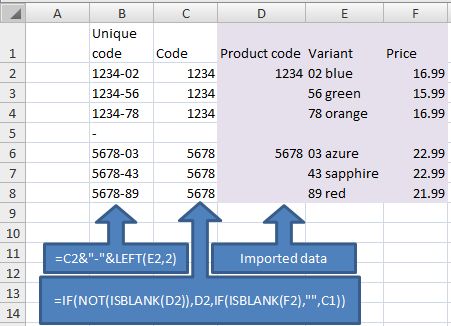
Many legacy systems export their data in human-readable form, rather than in blocks of data that are efficient for analysis. This graphic is an example, where the product code is listed once, then the variants are listed next to it.
For analysis, we need to generate a column that has the product code in every row that has other data. The formula in the middle box of the graphic does this. It roughly translates as
- “if the cell to the right is not blank, use it” (this picks up the product code where it appears)
- “otherwise, if the corresponding price cell is blank, give a blank” (this gives blanks in the rows that don’t have any data)
- “otherwise, use the cell above” (this is what puts the product codes in the rows that don’t currently have one).
Having generated the product code in each row, we now need to generate a cell with a unique id for the combination of product and variant. This uses the shorthand & to join together bits of text. In this example, we have joined the product code, a hyphen, and the left-hand two characters of the variant (using the LEFT() function).
We can now use the unique code to reference the data, e.g. with a VLOOKUP() function.


